Slide
Show JP
☰
探索
サインイン
サインアップ
アップロード
×
Gnuplotの使い方
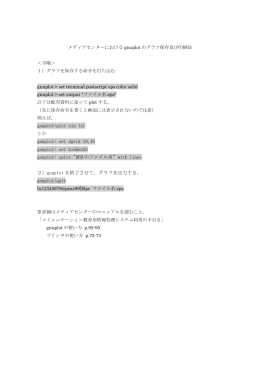
gnuplotによるグラフ化
gnuplotによるグラフ作成
gnuplotによるグラフ作成
gnuplotについて
gnuplotについて
Gnuplotについて
gnuplotについて
gnuplotとC言語
gnuplot>plot sin (x) gnuplot> set dgrid 10,10 gnuplot> set hidden3d
gnuplot3
gnuplot2
gnuplot1
gnuplot.pyの使い方
Gnuplot.py の使い方
gnuplot-lua-tikz パッケージの使用法
Gnuplot(10/26)
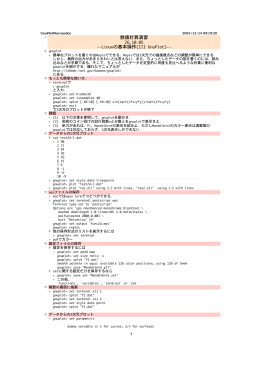
GNUPLOT 発展演習
Gnuplot を使ってグラフ作成 松尾行雄 ねらい 数値データをグラフに表示
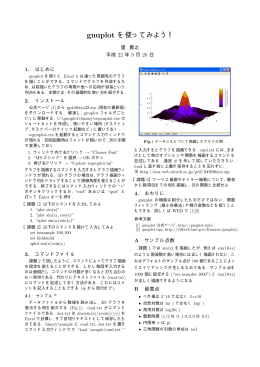
gnuplot を使ってみよう!
Gnuplot を使ってみよう
«
prev
1 ...
53469
53470
53471
53472
53473
53474
53475
53476
53477
... 101216
»
next